

In the two weeks after the Palisades and Eaton fires broke out in January 2025, the three major catastrophe (CAT) modellers published their insured loss estimates for Los Angeles. Moody’s RMS said $20–30 billion. Verisk said $28–35 billion. CoreLogic said $35–45 billion. There is a $25 billion disagreement between the low end and the high end of these estimates, for an event that had already happened, in one of the most heavily insured and best-mapped cities in the world. Swiss Re Institute now puts the insured loss at around $40 billion, at the upper edge of that range.
The point is not that the modellers were wrong. The full extent of wildfire damage is difficult to assess, and early estimates are always uncertain. The point is that a (re)insurer that relied on a single vendor view, with no internal capability to challenge it, would have reported to its board, its reinsurers and its regulator a number that could have been out by a factor of two. And while these particular fires were a world away in Los Angeles, this was not a distant event for the London market: Lloyd’s alone put its net loss from these fires at about $2.3 billion.
The Los Angeles fires were not an outlier. They were the clearest example of a structural shift:
- Secondary perils now dominate. Wildfire, severe convective storm and flood drove 92% of the $107 billion in global insured natural CAT losses in 2025, a record share. Severe convective storms alone cost insurers $51 billion.
- The trend is structural, not cyclical. Swiss Re estimates insured losses are growing 5–7% a year in real terms, with wildfire losses growing about 12% a year. On trend, 2026 losses would be about $148 billion. A modelled peak year could reach about $320 billion.
These are the perils that vendor models have historically treated as secondary, that depend most on granular exposure data and that are most sensitive to climate, building codes and urban growth. They are also the perils where a carrier’s own view of risk matters most.
The job of exposure management has outgrown the function
Most CAT functions were built for a narrower job. They ran vendor models to support reinsurance renewals, produced Realistic Disaster Scenarios and regulatory returns and answered ad hoc accumulation queries from underwriters.
But the job has expanded. Today, the same team is expected to defend an insurer’s own view of risk, steer portfolio mix, feed capital models, price secondary perils, respond to a live event within hours and explain climate trends to the board. Each new demand is usually met with a patch: another spreadsheet, another vendor licence and another analyst. The result is a function that works hard but cannot easily show that it is working well.
Supervisors have noticed. The UK Prudential Regulation Authority (PRA)’s 2026 priorities for general insurers flag persistent exposure data weaknesses and expect firms to invest in “systems, tools and models to ensure these remain appropriate for an evolving risk landscape.” The PRA will also intensify engagement with firms showing the largest gaps between assumed and realised profitability. In May 2026, its first dynamic general insurance stress test revealed a US West Coast earthquake, a Gulf hurricane, a UK windstorm, European floods and a cyber event in real time to firms covering 80% of the UK market. Participants reported having to bring in technical experts at short notice and cancel staff leave.
The symptoms of a function that has outgrown its design are familiar to most heads of exposure management:
- Exposure data is cleaned manually before every model run, and its quality is not measured.
- Model version changes arrive as surprises in capital, pricing and reinsurance results.
- Climate change and non-modelled perils/exposures are covered by loads nobody can fully justify.
- The board receives numbers it cannot meaningfully challenge.
None of these is fixed by a better model. They are fixed by redesigning the function around the decisions it supports. It’s clear that insurers must own their view of risk, but now the question is how does an organization build a CAT function that can carry the risk?
A ready-made benchmark: Lloyd’s Principle 2
The industry already has a well-tested yardstick for what a good CAT function looks like. Lloyd’s Principles for doing business at Lloyd’s sets out 13 outcome-based principles. Principle 2, Catastrophe Exposure, asks managing agents to keep “appropriate control of catastrophe risk… in line with business strategy” and breaks this into ten sub-principles. They cover risk appetite, data and tools, monitoring and reporting, resourcing, view of risk methodology, validation, completeness, change management, use of outputs, and governance of aggregations.
Two features make the framework useful well beyond the Lloyd’s market:
- First, it scales expectations to materiality. Each sub-principle has a maturity matrix running from Foundational to Advanced. Lloyd’s is explicit that “the more material a syndicate is to a particular Principle, the more sophisticated we would expect the syndicate’s capabilities to be.” A small, CAT-light book is not expected to look like a property-CAT reinsurer.
- Second, it asks about outcomes, not checklists. Lloyd’s contrasts a bottom-up question (“Have we checked all the requirements?”) with top-down ones: “How successful have we been in achieving the outcome?” and “Are there times when we have not been successful?” It adds that boards should not regard the Principles “as activities that can be delegated to compliance.”
The distance between the two ends of the matrix shows how much a transformation can deliver: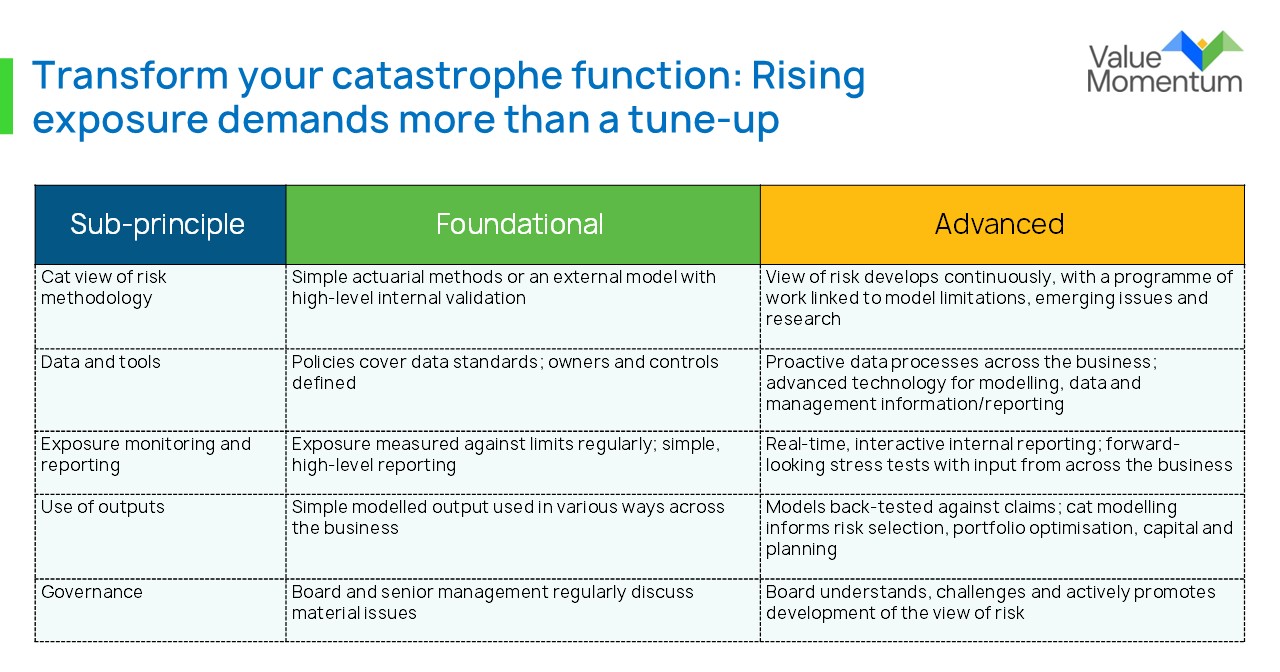 Source: Lloyd’s, Principle 2a maturity matrix (natural catastrophe), abridged.
The framework was written for syndicates, but its content maps closely onto Solvency UK, the PRA’s expectations for the ORSA and internal models and rating agency views. That makes it a practical, regulator-recognised reference point for any UK (re)insurer, including London market companies outside Lloyd’s.
Materiality before maturity
The single most important idea in the Lloyd’s approach is that maturity is judged relative to materiality. The question is not “is our catastrophe function sophisticated?” but “is it sophisticated enough for the catastrophe risk we actually carry?”
That reframing matters because both kinds of mismatch are costly. A function that is under-built for a material CAT book leaves the carrier exposed to mispriced risk, inefficient reinsurance and supervisory challenge. A function that is over-built for a modest exposure absorbs budget that could be spent elsewhere.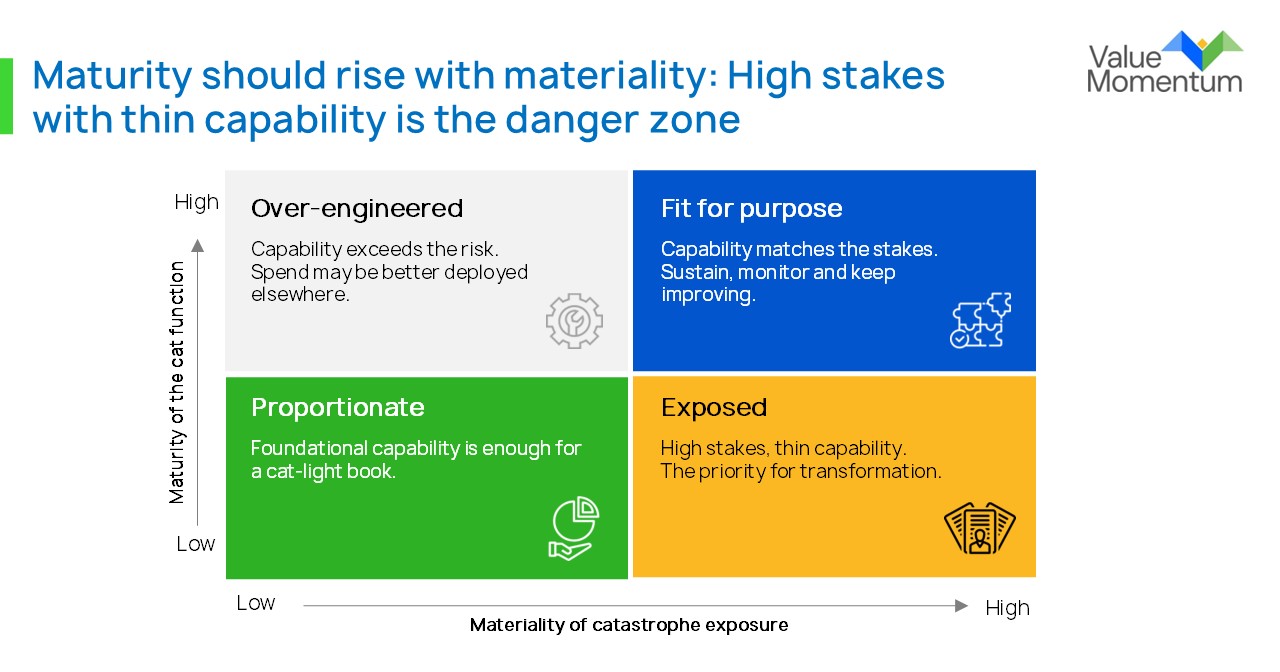
Materiality vs. maturity – four positions
Materiality should be measured, not assumed. Useful indicators include the share of required capital driven by CAT risk, modelled 1-in-100 and 1-in-250 losses relative to capital and earnings, CAT reinsurance spend, the weight of secondary and non-modelled perils, and growth plans in CAT-exposed lines. Maturity is then assessed against the ten sub-principles, using evidence rather than self-description.
A pathway to better exposure management
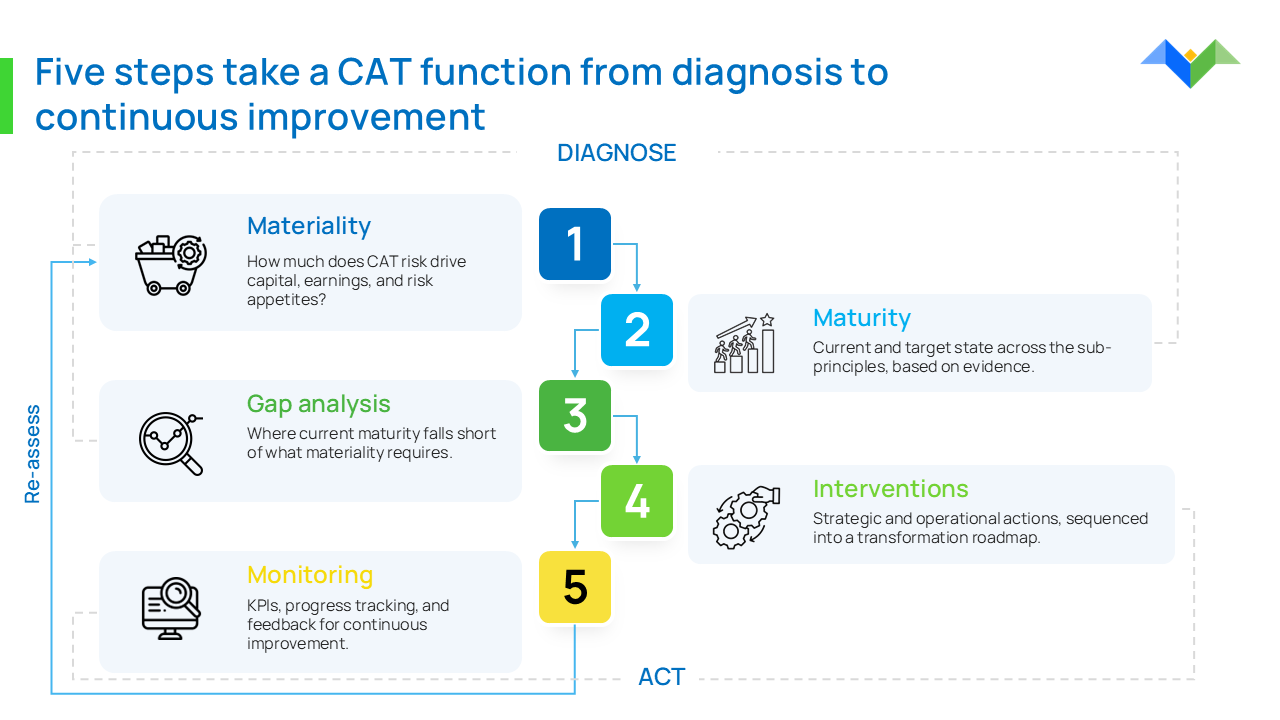
Transformation works best as a repeatable cycle that moves from diagnosis to action and back again, rather than a one-off review that produces a report and stops. There are five steps insurers can take to move their CAT function from diagnosis to a cycle of continuous improvement, and they fall into two phases:
Phase One: Diagnose
1. Materiality
Establish how much CAT risk drives capital, earnings and risk appetite.
2. Maturity
Assess the current and target state of the CAT function across the ten sub-principles, based on evidence.
3. Gap analysis
Identify where current maturity falls short of what materiality requires.
Phase Two: Act
4. Interventions
Define the strategic and operational actions needed to close the gaps, and sequence them into a transformation roadmap.
5. Monitoring
Track progress against KPIs and gather feedback to drive continuous improvement. Then re-assess materiality and maturity regularly. This giant feedback loop makes transformation an ongoing cycle rather than a one-off project.
The gap analysis is the hinge. It links the two phases and turns the diagnosis into a prioritised list of shortfalls, each tied to a sub-principle and to the decision it affects. That is what makes the case for investment concrete: A gap in validation is a capital question, a gap in data is a pricing question and a gap in event response is a reputational and regulatory question.
From diagnosis to transformation
Transformation is a shared agenda. Exposure management, actuarial and enterprise risk each own part of the CAT view, and each feels the gaps differently. A simple test is whether each leader can answer their core question quickly and defend the answer.
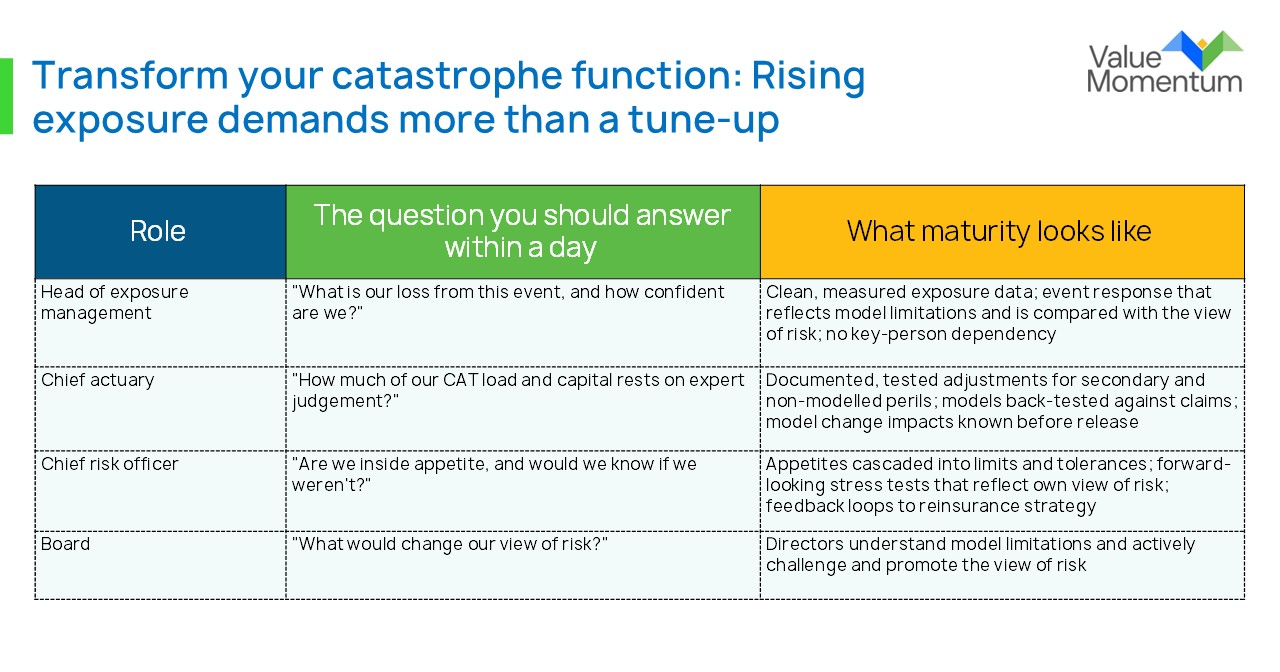 If any of these answers takes a week to come up with, involves several spreadsheets or depends on one person, the gap is real, and it is costing money in reinsurance spend, capital and missed underwriting opportunities.
The evidence points one way. Catastrophe losses are rising structurally, the perils driving them are the hardest to model, and regulators are testing response capability live. A CAT function that is merely busy is no longer enough. It must be demonstrably fit for the materiality of the risk it manages.
A useful first step is a short, structured conversation: where does your catastrophe exposure sit on the materiality scale, and where does your function sit on the maturity scale? To start the conversation, contact our Risk Analytics team.